Core Web Vitals in plain language: 3 numbers that decide how fast your site feels
LCP, INP, and CLS explained without jargon, with the thresholds Google treats as good and practical fixes you can ship this week.
A website can pass every speed test and still feel slow. Core Web Vitals exist to measure what visitors actually notice: how quickly the main content appears, how fast the page reacts, and whether things jump around while loading. Google uses them as part of its page experience signals, so they matter for both users and search visibility.
The three numbers
LCP: Largest Contentful Paint
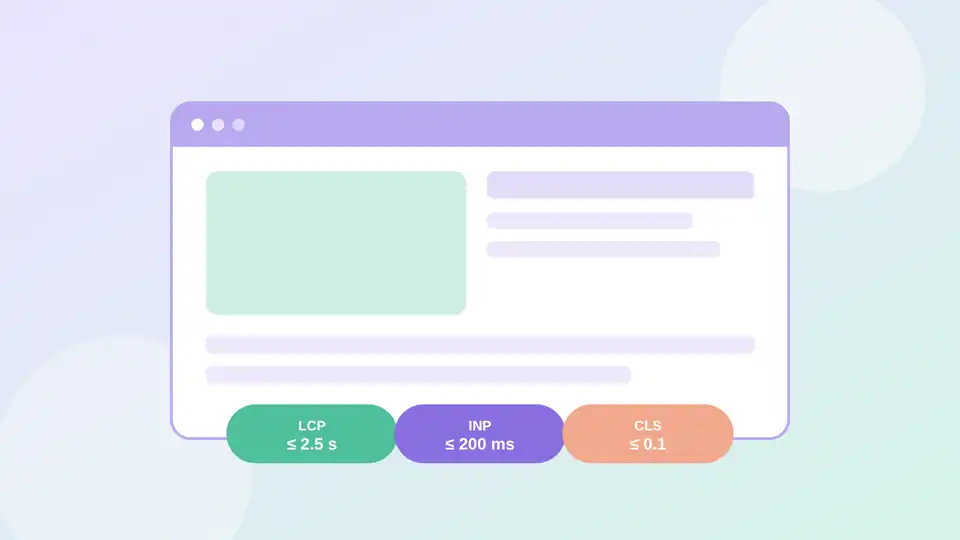
LCP is the time it takes for the biggest visible element, usually a hero image or a headline, to render. A good score is 2.5 seconds or less.
INP: Interaction to Next Paint
INP measures how quickly the page responds after a tap, click, or key press. A good score is 200 milliseconds or less. It replaced the older FID metric in March 2024 because it looks at all interactions during a visit, not just the first one.
CLS: Cumulative Layout Shift
CLS adds up unexpected movement of content, like a button that slides away just as you tap it. A good score is 0.1 or less.
Google evaluates these at the 75th percentile of real visits, which means three out of four visitors should have a good experience, not just the average one.
Quick wins for each metric
Improving LCP
Compress the hero image and serve it in a modern format such as WebP or AVIF.
Do not lazy-load the image that appears at the top of the page; preload it instead.
Reduce server response time with caching or a CDN.
Improving INP
Break long JavaScript tasks into smaller pieces so the browser can respond between them.
Delay third-party scripts such as chat widgets and trackers until they are needed.
Keep event handlers light; do heavy work after the visual update.
Improving CLS
Always set width and height (or an aspect ratio) on images and videos.
Reserve space for ads, banners, and embeds before they load.
Use
font-display: swaptogether with a similar fallback font to limit text jumping.
How to measure
Use PageSpeed Insights or the Chrome UX Report to see real-world field data, and Lighthouse in Chrome DevTools to debug in the lab. Field data tells you what users experience; lab data tells you why.
Fix one metric at a time, re-measure, and keep the change that moves the number.
Small, measured improvements beat a big rewrite. Start with your slowest important page, and let the data guide the next step.